Ever-changing Market Scenarios
Last week’s U.S. equities market resembled a dull painting session – uneventful, with minuscule price ranges and volumes, lacking any notable news or excitement. However, this week has taken a drastic turn. Meme stocks like GameStop (GME) and AMC (AMC) surged after a famous online persona, “Roaring Kitty,” resurfaced with a tweet. Simultaneously, the less-loved Chinese bull market persisted, with ADRs such as Alibaba (BABA) and Futu Holdings (FUTU) climbing more than 5% each on robust trading activity.
Impending Economic Calendar Events
While individual stocks steal the spotlight, investors must sift through upcoming economic indicators and market events.
Tuesday, May 14th: Producer price index (PPI) @ 8:30 am EST, Fed Chair Jerome Powell speaks @ 10:00 am EST
Wednesday, May 15th: Consumer price index (CPI), U.S. retail sales @ 8:30 am EST
Short-Term Market Prospects
Inflation remains a persistent thorn for Jerome Powell and the Federal Reserve. Consequently, heightened volatility is anticipated later in the week. With the S&P 500 Index ETF (SPY) on a seven-day winning streak, a temporary retreat would not be surprising, especially as historical data indicates lower trends during May’s monthly options expiration weeks.
Intermediate/Long-Term Viewpoint
Recognizing the contradictory information provided by different timeframes is crucial for successful market analysis. The intermediate to long-term perspective offers a more optimistic outlook.
Put/Call Ratio Insights
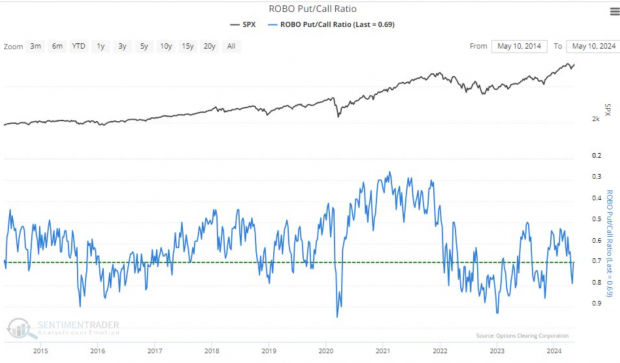
The put/call ratio serves as a valuable gauge for market sentiment and speculation levels. Despite notable movements in individual stocks, the put/call ratio remains steady, suggesting normalcy without signs of excessive speculation.

Image Source: Sentimentrader
Institutional Fear & Greed Metrics
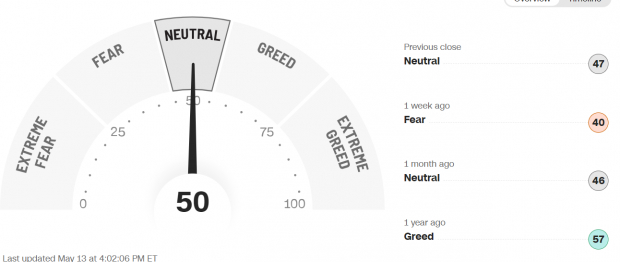
The CNN Fear and Greed Index aligns closely with the put/call ratio analysis, depicting a “Neutral” sentiment despite the minor slack in major indices from their all-time peaks.

Image Source: CNN
Diverse Market Participation
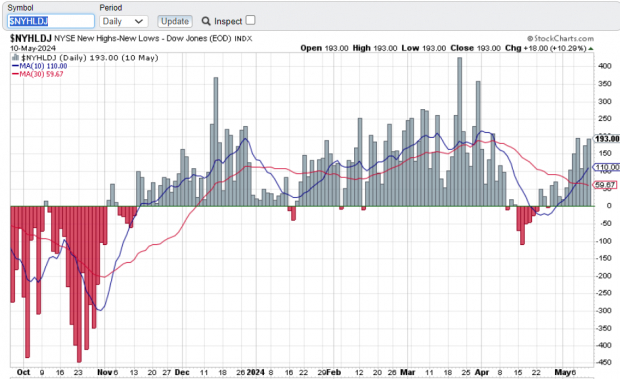
The Net New Highs Indicator underscores the broadening participation in the market, indicating more stocks hitting new highs than lows as the market rallies.

Image Source: Stockcharts.com
Summing Up the Situation
Investors are gearing up for short-term fluctuations as key economic data approaches. While there might be turbulence in the immediate future, the overall market outlook for the intermediate and long term appears optimistic.
