Only half a year into 2024, the S&P 500 and Nasdaq Composite have seen substantial double-digit gains, flirting with their all-time highs.
Among the key beneficiaries of this roaring market is the semiconductor giant Nvidia (NASDAQ: NVDA). With a staggering 156% surge in its share price this year, Nvidia briefly outpaced Microsoft to become the most valuable company globally as its market cap soared past $3.3 trillion.
Delving beyond its reputation as a semiconductor powerhouse, Nvidia’s revenue breakdown sheds light on the diverse revenue streams supporting its growth, particularly within the realm of artificial intelligence (AI).
Unpacking Nvidia’s Revenue Streams
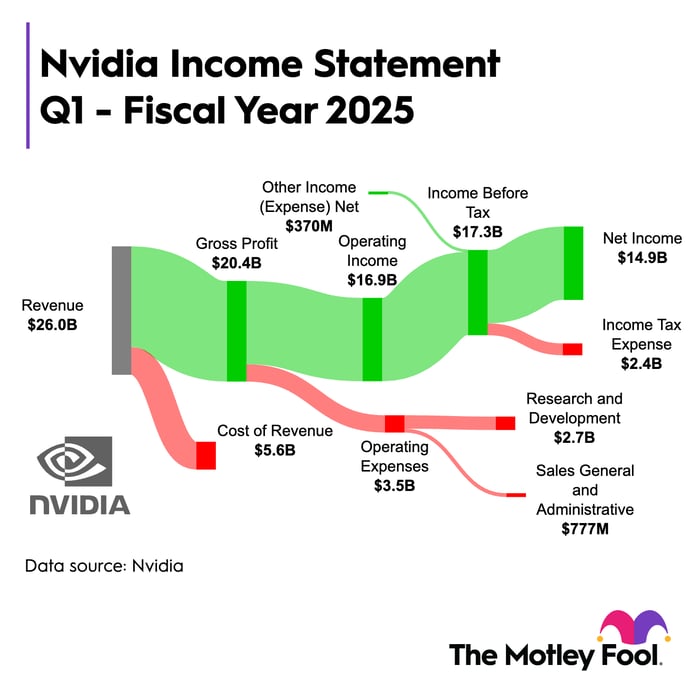
Illustrated below is Nvidia’s income statement for the first quarter of fiscal 2025 (ending April 30).

Image source: The Motley Fool.
During the quarter ending April 30, Nvidia raked in a total revenue of $26 billion. The breakdown of revenue by category is as follows:
| Category | Revenue |
|---|---|
| Data Center-Compute | $19.4 billion |
| Data Center-Networking | $3.2 billion |
| Gaming | $2.6 billion |
| Professional Visualization | $0.4 billion |
| Automotive | $0.3 billion |
| OEM and Other | $0.1 billion |
Data source: Nvidia Investor Relations.
Nvidia’s data-center services stand out as the primary revenue generator, fueled by soaring demand for graphics processing units (GPUs) and their pivotal role in generative AI initiatives, positioning Nvidia as a leader in compute and networking solutions.
Scrutinizing revenue alone is insufficient when evaluating a company’s financial standing. Examining Nvidia’s expense structure and profitability paints a more comprehensive picture of its financial performance.
The Ramifications on Cash Flow and Liquidity
During Q1, Nvidia incurred $5.6 billion in cost of goods sold (COGS), resulting in a gross profit of $20.4 billion and a robust 78.4% profit margin.
Noteworthy is Nvidia’s significant expansion in gross margin over recent years, predominantly driven by its prowess in AI chips. However, a pivotal factor elevating Nvidia’s profitability is its unmatched pricing power, stemming from superior chips like H100, A100, and the new Blackwell series, overshadowing competitors like Intel and Advanced Micro Devices.
Market research unveils Nvidia’s potential dominant share of up to 95% in the AI chip sector, allowing the company to command premium prices for its products compared to rivals.
Operational expenses for Nvidia surged by 39% year-over-year to $3.5 billion in Q1. While a substantial uptick, this rise is outpaced by the accelerated growth in revenue and profits, equipping Nvidia with ample financial resources to invest in research and development and attract top engineering talent.
The most striking financial metric from the data is Nvidia’s net income of $14.9 billion. Despite revenue skyrocketing by 262% year-over-year in Q1, net income soared by an impressive 628%.
Nvidia’s meteoric rise in both top and bottom lines signals its ability to amass substantial cash reserves.
Ending Q1 with $31.4 billion in cash and equivalents on the balance sheet, triple its outstanding debt, showcases Nvidia’s robust liquidity to service liabilities while fueling aggressive innovation initiatives.
