Wall Street expects Applied Materials Inc AMAT to report $2.19 in earnings per share and $6.95 billion in revenues when the company posts fourth-quarter earnings after market hours.
The stock is up 20.48% over the past year and 20.25% year-to-date.
Let’s look at what the charts indicate for Applied Materials stock and how the stock currently maps against Wall Street estimates.
Read Also: Applied Materials Earnings Are Imminent; These Most Accurate Analysts Revise Forecasts Ahead Of Earnings Call
Applied Materials Technical Setup Ahead Of Q4 Earnings
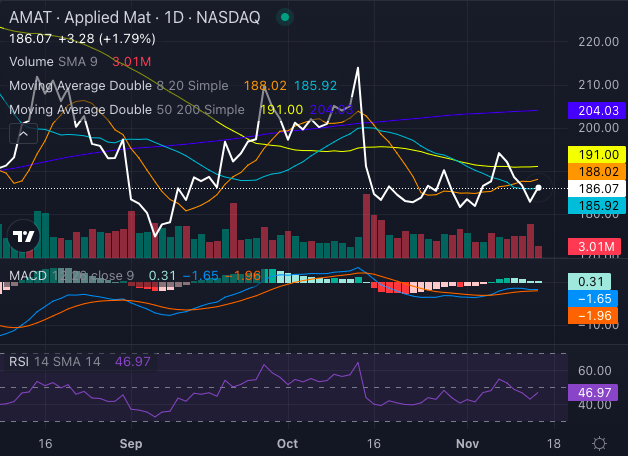
Applied Materials stock is currently showing signs of a bearish trend, with the stock trading below its key exponential moving averages (five, 20 and 50-day), indicating continued selling pressure and potential downside.

Chart created using Benzinga Pro
Applied Materials stock price of $186.07 has fallen below several crucial simple moving averages (eight-day at $188.02, 20-day at $185.92, 50-day at $191 and 200-day at $204.03), each presenting a bearish signal.
The MACD (moving average convergence/divergence) reading of negative 1.65 supports this view, suggesting downside momentum.
Meanwhile, the RSI at 46.97 indicates AMAT stock is nearing oversold territory, potentially signaling short-term relief.
However, technical indicators broadly suggest caution for now.
Applied Materials See 9% Upside
Ratings & Consensus Estimates: The consensus analyst rating on Applied Materials stock stands at a Buy currently with a price target of $214.89. The latest analyst ratings from Stifel and Susquehanna give Applied Materials stock an average price target of $203.33, suggesting a potential 9.23% upside.
Price Action: Applied Materials stock was trading at $185.75 at the time of publication.
Read Next:
Image: Shutterstock
Market News and Data brought to you by Benzinga APIs
