Small Caps Energized by Fed’s Rate Cut Expectations
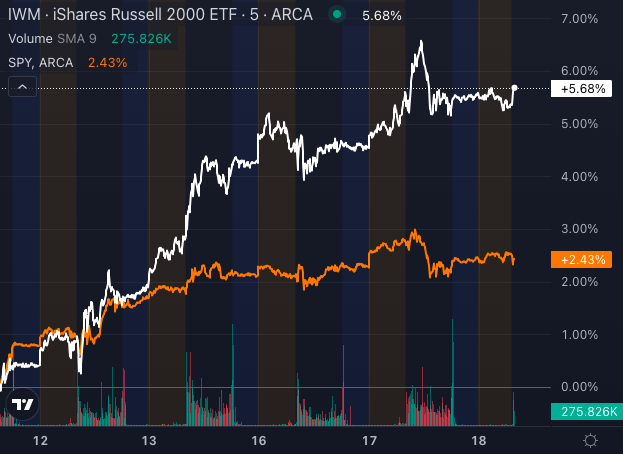
Small-cap stocks have ignited with fervor in anticipation of the Federal Reserve’s forthcoming interest rate cut, basking in the glow of the spotlight. Over recent days, the Russell 2000 Index has asserted its dominance, surging over 5%, outshining its larger counterparts in the S&P 500 Index, which only saw a modest 2.5% uptick.

Evident in this uptrend, the iShares Russell 2000 ETF (IWM) that tracks the Russell 2000 Index has outperformed the SPDR S&P 500 ETF (SPY) which tracks the S&P 500 index. Driving this small-cap resurgence are various stocks like IGM Biosciences Inc (IGMS), Intuitive Machines Inc (LUNR), and Applied Therapeutics Inc (APLT), showing remarkable gains over the past five days.
Small Caps Anticipating Reduced Borrowing Costs
Investors are bullish about an imminent Fed rate cut as small-cap companies, especially those reliant on floating-rate debt, stand to benefit. With a potential drop in interest rates, the borrowing costs for these companies are poised to decrease. This scenario may provide companies with weaker balance sheets some relief, igniting investor interest in these smaller stocks for potential substantial returns.
Nevertheless, amidst the excitement, it’s crucial to note a potential caveat.
Earnings and Economic Conditions: The Wildcards
While the allure of cheaper borrowing remains enticing, concerns loom over sluggish earnings and an uncertain U.S. economic forecast. Therefore, the hype surrounding small caps could quickly fade if economic conditions do not hold up their end of the bargain.
For investors seeking exposure, ETFs such as the Vanguard Small-Cap ETF (VB) and the IWM offer diversified small-cap stock portfolios, shielding investors from individual stock risks.
Yet, the burning question remains: how sustainable is this small-cap rally?
Small Cap ETFs Illustrate Strong Bullish Trends

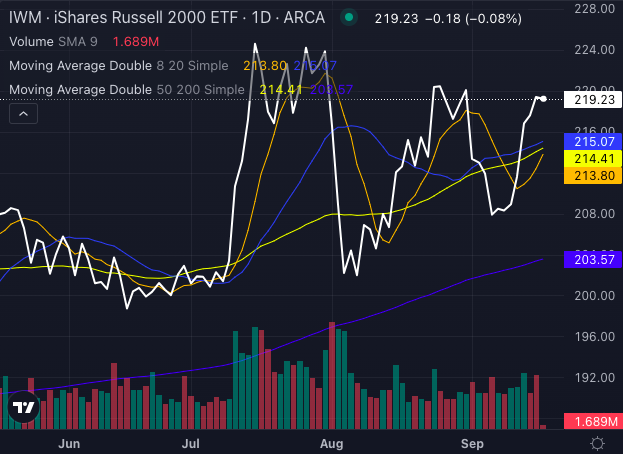
The IWM, as a proxy for small-cap stocks, is currently exhibiting a robust bullish trend. Trading at $219.23, its share price remains above the five, 20, 50, and 200-day simple moving averages (SMAs).
The eight-day SMA at $213.80, the 20-day SMA at $215.07, and the 50-day SMA at $214.41 all signal a bullish trajectory, reflecting the ETF’s strong upward momentum. Despite a slight selling pressure, indicating potential short-term volatility, the ETF’s positioning well above its 200-day SMA of $203.57 highlights a favorable technical outlook, suggesting continued strength in the small-cap market.
Whether the Fed opts for a significant rate cut or a more conservative approach, small caps are poised to take center stage. Monitoring ETFs like the SPDR S&P 600 Small Cap ETF (SLY) can offer broader exposure to small-cap companies anticipated to benefit from lower interest rates.
As the market landscape evolves, investors would benefit from staying informed and agile to maximize opportunities in a dynamic environment.
